
In this tutorial, we will implement a simple temperature logger on the Raspberry Pi 3 and connect four DS18B20 temperature sensors to it.
The temperature measurements will be stored in a database along with a time stamp. We have selected InfluxDB as the database engine as this is a time-series database and integrates very easy to Grafana.
Grafana will retrieve and visualize the data stored in the database. Grafana is an open source solution for running data analytics, pulling up metrics that make sense of the massive amount of data, and to visualize our results in the form of graphs and gauges with the help of very cool customizable dashboards.
Everything is running on the Raspberry so before start writing code we have to do some preparing:
- Setup the 1-wire bus on raspberry pi to be able to communicate with the DS18B20 sensor
- Connect temperature sensors to the Raspberry GPIO
- Install InfluxDb and Grafana
- Add required python libraries
1. Setup the 1-wire bus on raspberry Pi 3.
The Raspberry Pi Rasbian operating system has a 1-wire bus driver that can use GPIO4 as data in/out if enabled. It provides low-speed data, signaling, and power over a single conductor. Low cost 1-wire devices such as the DS18B20 temperature sensor commonly connects to this port. The default Raspbian image disables the interface by default so before you can use it we must make a configuration change.
Open the command line CLi terminal and execute the following bash command that will start the raspberry config utility:
sudo raspi-config
This will start the raspi-config utility. Select 5 “Interfacing Options” :

Highlight the “1-wire” option and activate <Select > :

On the next screen Select and activate <Yes >.
When prompted to reboot highlight and activate <Yes > .
The Raspberry Pi will reboot and the interface will be enabled ready for use.
2. Connect the DS18B20 sensors to the raspberry IO.
The circuit drawing below shows how to connect four DS18B20 sensors to the Raspberry GPIO. It is important to connect the DS18B20 Vcc pin to +3.3V as the raspberry GPIO port is runned on 3.3V. A pullup resistor of 4.7kOhm have been connected between +3.3V and GPIO4. When the 1-wire peripheral is enabled in the raspberry, GPIO4 is configured as data in/out pin, which connects to DS18B20 data (DQ) pin.
Use low capacitance cable if you plan to place sensors far away, 10 -100m. Ethernet cable is cheap and works well. Connect GND and DQ to one of the pair, and 3.3V on another wire pair.
Place your sensors along the cable (linear network topology), starting from the master and extending to the farthest slave device. This will make the communication more robust and with less errors. Other slaves connects to the 1-wire bus cable with insignificant branches (<3m) or stubs.

3. Verify the 1-wire DS18B20 communication.
Now is the time to test if the raspberry is able to communicate with the sensors.
Open the command line interface Terminal, and at the command prompt enter:
sudo modprobe w1–gpio
modprobe w1-gpio registers the new sensors connected to GPIO4 so that the Raspberry Pi knows that there is a 1-Wire device connected to the GPIO connector.
modprobe is a Linux program used to add a loadable kernel module (LKM) to the Linux kernel or to remove a LKM from the kernel. It is commonly used to load drivers for automatically detected hardware.
Then run the command:
sudo modprobe w1-therm
modprobe w1-therm tells the Raspberry Pi to add the ability to measure temperature on the 1-Wire system.
To allow the w1_gpio and w1_therm modules to load automatically at boot we can edit the /etc/modules file and include both modules there where they will be started when the Pi boots up. Edit the /etc/modules file using the nano editor:
sudo nano /etc/modules
Add the following to the file and then save and exit.
# /etc/modules: kernel modules to load at boot time.
#
# This file contains the names of kernel modules that should be loaded
# at boot time, one per line. Lines beginning with "#" are ignored.

w1-gpio
w1-therm
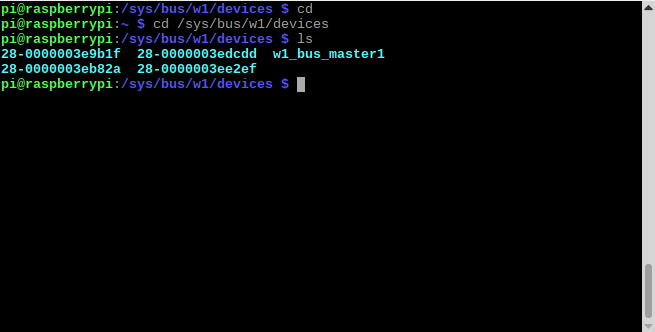
Change directories to the /sys/bus/w1/devices directory by entering:
cd /sys/bus/w1/devices
Now enter ls to list the devices:
ls
This should list out the contents of the /sys/bus/w1/devices which should include a number of directories starting 28-. The number of directories should match the number of connected sensors. The portion of the name following the 28- is the unique serial number of each of the sensors.
We then cd into one of those directories:
cd 28-xxxxxxxxxxxx
( Change xxxxxxxxxxxx to match the serial number of one of the directories )
We are then going to view the ‘w1_slave’ file with the cat command using:
cat w1_slave
The cat program takes the specified file (or files) and by default outputs the results to the screen (there are a lot of different options for cat, more can be found here).
The output should look something like the following:
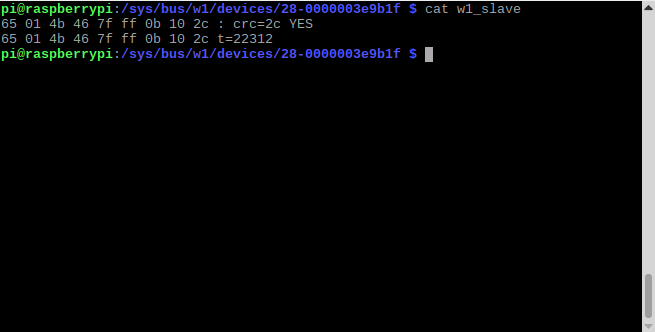
At the end of the first line we see a YES for a successful CRC check (CRC stands for Cyclic Redundancy Check, a good sign that things are going well). If we get a response like NO or FALSE or ERROR, it will be an indication that there is some kind of problem that needs addressing. Check the circuit connections and start troubleshooting.
At the end of the second line we can now find the current temperature. The t=22312 is an indication that the temperature is 22.312 degrees Celsius (we need to divide the reported value by 1000).
To convert from degrees Celsius to degrees Fahrenheit, multiply by 1.8, then add 32.
cd into each of the 28-xxxx directories in turn and run the cat w1_slave command to check that each is operating correctly. It may be useful at this stage to label the individual sensors with their unique serial numbers to make it easy to identify them correctly later.
4. Install the Influx database on the Raspberry Pi
a. Installing the Influx database is pretty simple. Please follow the instructions in this article.
b. Do not forget to start the Influxdb service on the Raspberry Pi by running this bash command in the terminal:
sudo service influxdb start
c. With InfluxDB installed, you are ready to start doing some great things. We will use the influx command line interface (CLI), which is included in all InfluxDB packages and is a lightweight and simple way to interact with the database. The CLI communicates with InfluxDB directly by making requests to the InfluxDB HTTP API over port 8086 by default.
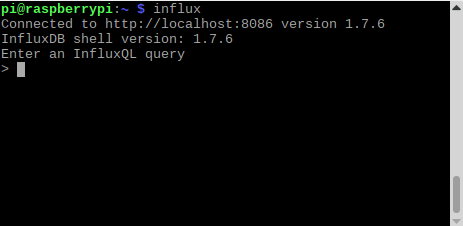
The influx command should be available via the command line. Executing…
influx
…in the Raspberry terminal will start the CLI and automatically connect to the local InfluxDB instance (assuming you have already started the server with service influxdb start or by running influxd directly). The output should look like this:
The command line is now ready to take input in the form of the Influx Query Language (a.k.a InfluxQL) statements. A fresh install of InfluxDB has no databases (apart from the system _internal), so creating one is our first task. You can create a database with the CREATE DATABASE
CREATE DATABASE temp_logger_db
Now that the temp_logger_db database is created, we’ll use the SHOW DATABASES statement to display all existing databases:
SHOW DATABASES
The output will be something like this:
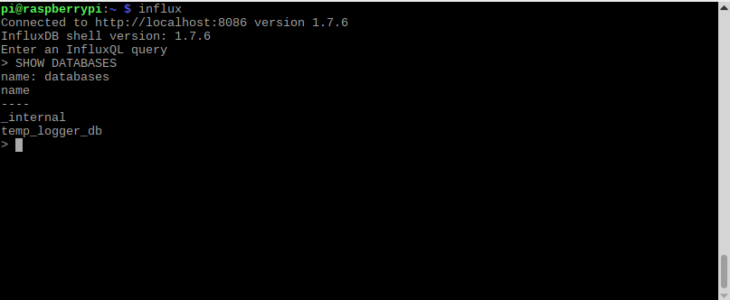
We have created a database and it is ready to be used in our temperature logger application. Exit the Influx shell by typing the command:
exit
5. Install the Grafana server on the Raspberry Pi
a. Installing the Grafana realtime graph dashboard is pretty simple. Please follow the instructions in this article.
b. Please remember to start the Grafana server:
sudo service grafana-server start
This will start the grafana-server process as the grafana user, which was created during the package installation. The default HTTP port is 3000 and default user and psw is “admin”.
To configure the Grafana server to start at boot time:
sudo update-rc.d grafana-server defaults
6. Install the required python libraries
We are using python3 in this datalogger example which have a slightly different syntax than the “retired” python2.
Like many Python libraries, the easiest way to get up and running is to install the library using pip.
We’re going to run pip using the -m argument to the Python command, in order to be sure which Python is the install target.
python3 -m pip install influxdb
You should see some output indicating success.
You could display all your python3 stuff/libraries by running:
dpkg --get-selections | grep python3
or run
help ('modules')
when in the python shell.
7. Temperature logger python code
# -*- coding: utf-8 -*-
import os
import glob
import argparse
import time
import datetime
import sys
from influxdb import InfluxDBClient

os.system('modprobe w1-gpio')
os.system('modprobe w1-therm')

# add more sensor variables here based on your setup

temp=['sensor code','tttttttttt','ddddddddddd','ssssssssss']
base_dir = '/sys/bus/w1/devices/'

device_folders = glob.glob(base_dir + '28*')

snum=4 #Number of connected temperature sensors

# Set required InfluxDB parameters.
# (this could be added to the program args instead of beeing hard coded...)
host = "localhost" #Could also use local ip address like "192.168.1.136"
port = 8086
user = "root"
password = "root"

# Sample period (s).
# How frequently we will write sensor data from the temperature sensors to the database.
sampling_period = 5

def read_temp_raw(device_file):
    f = open(device_file, 'r')
    lines = f.readlines()
    f.close()
    return lines

def read_temp(device_file): # checks the temp recieved for errors
    lines = read_temp_raw(device_file)
    while lines[0].strip()[-3:] != 'YES':
        time.sleep(0.2)
        lines = read_temp_raw(device_file)

    equals_pos = lines[1].find('t=')
    if equals_pos != -1:
        temp_string = lines[1][equals_pos+2:]
        # set proper decimal place for C
        temp = float(temp_string) / 1000.0
        # Round temp to 2 decimal points
        temp = round(temp, 1)
    # value of temp might be unknown here if equals_pos == -1
    return temp

def get_args():
    '''This function parses and returns arguments passed in'''
    # Assign description to the help doc
    parser = argparse.ArgumentParser(description='Program writes measurements data from the connected DS18B20 to specified influx db.')
    # Add arguments
    parser.add_argument(
        '-db','--database', type=str, help='Database name', required=True)
    parser.add_argument(
        '-sn','--session', type=str, help='Session', required=True)
    now = datetime.datetime.now()
    parser.add_argument(
        '-rn','--run', type=str, help='Run number', required=False,default=now.strftime("%Y%m%d%H%M"))

    # Array of all arguments passed to script
    args=parser.parse_args()
    # Assign args to variables
    dbname=args.database
    runNo=args.run
    session=args.session
    return dbname, session,runNo

def get_data_points():
    # Get the three measurement values from the DS18B20 sensors
    for sensors in range (snum): # change number of sensors based on your setup
        device_file=device_folders[sensors]+ '/w1_slave'
        temp[sensors] = read_temp(device_file)
        print (device_file,sensors,temp[sensors])
    # Get a local timestamp
    timestamp=datetime.datetime.utcnow().isoformat()

    # Create Influxdb datapoints (using lineprotocol as of Influxdb >1.1)
    datapoints = [
        {
            "measurement": session,
            "tags": {"runNum": runNo,},
            "time": timestamp,
            "fields": {"temperature 1":temp[0],"temperature 2":temp[1],"temperature 3":temp[2],"temperature 4":temp[3]}
        }
        ]
    return datapoints

# Match return values from get_arguments()
# and assign to their respective variables
dbname, session, runNo =get_args()
print ("Session: ", session)
print ("Run No: ", runNo)
print ("DB name: ", dbname)

# Initialize the Influxdb client
client = InfluxDBClient(host, port, user, password, dbname)

try:
     while True:
        # Write datapoints to InfluxDB
        datapoints=get_data_points()
        bResult=client.write_points(datapoints)
        print("Write points {0} Bresult:{1}".format(datapoints,bResult))

        # Wait for next sample
        time.sleep(sampling_period)

        # Run until keyboard ctrl-c
except KeyboardInterrupt:
    print ("Program stopped by keyboard interrupt [CTRL_C] by user. ")
Save the script as ‘templogger.py’ and run using
python templogger.py. -db=temp_logger_db -sn=test1
To run the script in the background and indefinitely as a ssh user use:
nohup python templogger.py &
Let us understand key points of the code listing above:
We import the InfluxDBClient class at the start of the program code.
We define two constants, one for the InfluxDB Host, which is the Public IP of your Compute Engine instance. Remember to replace it in the code.
The next statement is important. We initialize the InfluxDBClient with the hostname, port (8086 for the API) and provide it with the database name.
Now that we have the client object, we can then either query or insert database records.
The “write_points” method takes a list of measurement points and writes it to the Influx database. Each measurement point, specifies the measure,
one or more tags (test1 and runNo), and the four field values. Also notice that we are passing in the timestamp so that we record the timestamp from the board that it was recorded on. We use the `datetime` package in python to help us get the Unix timestamp that we will send to InfluxDB.
The result of the `write_points` method is of boolean type. It returns “true” if successful.
8. Configure the Grafana dashboard
While the templogger.py is running it is time to get the data from the influx database to show up as nice graphs in Grafana.
Unlike InfluxDB, Grafana doesn’t enable it’s service, so do this to enable at boot and start the service now:
sudo systemctl enable grafana-server
sudo systemctl start grafana-server
Navigating your web browser to port 3000, you should be presented with the Grafana web GUI.
http://localhost:3000 or your raspberry IP: http://xx.xx.xx.xx:3000
Log in using psw: admin user:admin
Add datasource:
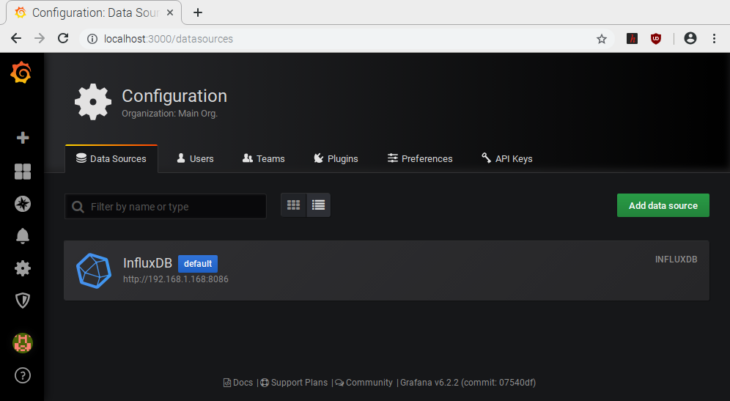
Under the data source selection window you have the option to select among a lot of different data source types. Select InfluxDb. The following data source configuration window should open:

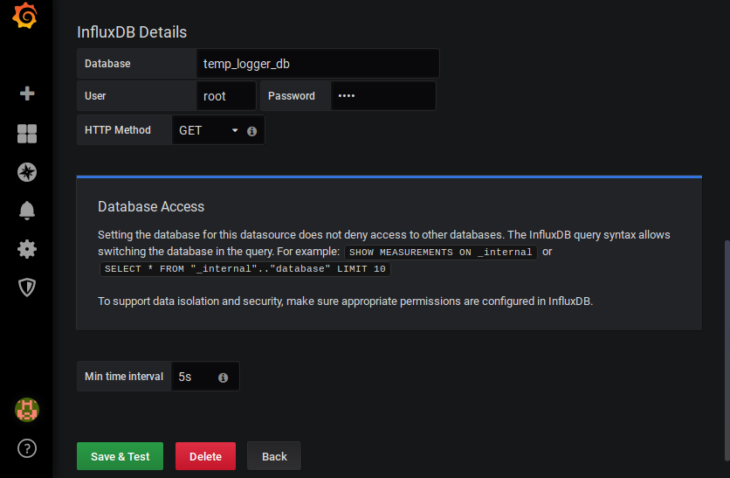
Edit the input boxes as above example
Note! using http://localhost:8086 will not work. You should use your full raspberry ip address number e.g. “192.168.1.168”.
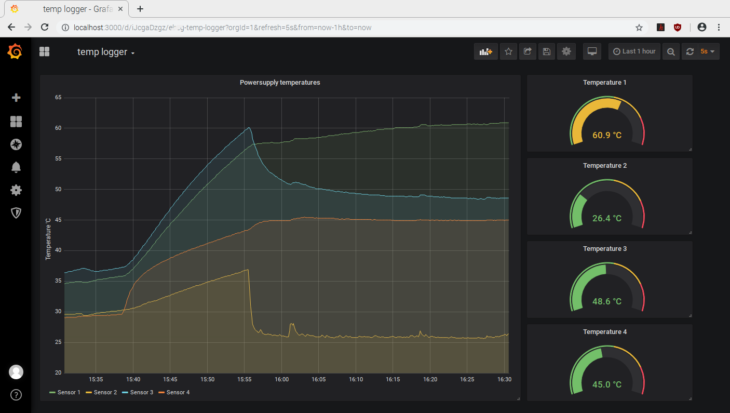
The next task is to set up the grafana dashboard for our temperature logger.
From the grafana menu select + Create and then select dashboard.
This is how we have set up a basic dashboard that gives you a gauge and a graph for each of the 4 temperature readings that we are taking.
So by now hopefully you’ve got the project fully up and running, have accessed the dashboard and have been taking readings and filling up your database. Here are a few more things to take a look at before you move on to the next project.
What next?
The dashboard and reporting software, Grafana, has a lot of configuration options and settings for you to play with.
You can customize each panel on Grafana after you have logged in by hovering over the title and going to edit. I recommend having a play with the options – the changes to your dashboard are not saved automatically so if you make a mistake you can reload the page and everything will revert to how it was. If you make some changes you want to keep, hit save at the top of the dashboard and all of your settings will be saved to your device.
Thanks for reading!


One comment
Pingback: No module named influxdb – Ask python questions